Market Outlook
August 24, 2016
Market Cues
Domestic Indices
Chg (%)
(Pts)
(Close)
Indian markets are likely to open on a negative note tracking SGX Nifty.
BSE Sensex
0.0
5
27,990
Nifty
0.0
3
8,633
After moving higher in the session, US markets gave up some of their gains to close
slightly positive on Tuesday. Housing stocks were a strong driver for the rally after
Mid Cap
(0.3)
(36)
12,945
housing starts data came in much better than expectations. Energy stocks rallied as
Small Cap
(0.1)
(9)
12,434
well with gold stocks continuing their decline from the last session.
Bankex
0.1
23
22,199
European markets ended higher on Tuesday on strong economic data that
suggested a revival in economic activity. The FTSE was helped by advances in
Global Indices
Chg (%)
(Pts)
(Close)
mining and financial services stocks. Among the gainers was BHP Billiton PLC which
Dow Jones
0.1
18
18,547
rallied 4% after a ratings upgrade due to improving industry fundamentals.
Nasdaq
0.3
15
5,260
The Indian market ended Tuesday's session on a flat note. Markets initially moved
FTSE
0.6
40
6,869
downwards on strong selling but a strong performance from the IT stocks pulled the
Nikkei
(0.6)
(101)
16,497
indices up and the markets closed flat. Sentiment was also muted due to upcoming
Hang Seng
0.0
1
22,999
expiry on Thursday.
Shanghai Com
0.2
5
3,090
News Analysis
ONGC Videsh Ltd. gets 1 year extension on exploring Vietnamese oil block
Advances / Declines
BSE
NSE
Detailed analysis on Pg2
Advances
1,304
735
Declines
1,397
866
Investor’s Ready Reckoner
Unchanged
192
86
Key Domestic & Global Indicators
Stock Watch: Latest investment recommendations on 150+ stocks
Volumes (` Cr)
Refer Pg5 onwards
BSE
3,337
Top Picks
NSE
18,396
CMP
Target
Upside
Company
Sector
Rating
(`)
(`)
(%)
Amara Raja
Auto/Auto Ancillary
Buy
890
1,076
20.9
Net Inflows (` Cr)
Net
Mtd
Ytd
HCL Tech
IT
Buy
789
1,000
26.7
FII
(113)
7,944
38,827
HDFC Bank
Financials
Accumulate
1,252
1,350
7.8
MFs
194
218
9,007
Bharat Electronics
Capital Goods
Buy
1,221
1,414
15.8
Equitas Holdings
Financials
Buy
181
235
29.7
Top Gainers
Price (`)
Chg (%)
Navkar Corporation Others
Buy
200
265
32.3
Jpinfratec
9
12.6
More Top Picks on P3
Indiacem
140
8.4
Key Upcoming Events
Idea
101
6.7
Previous
Consensus
Date
Region
Event Description
Jpassociat
12
5.6
Reading
Expectations
Aug 24 Germany
PMI Manufacturing
53.8
--
Gsfc
77
4.3
Aug 26
US
GDP QoQ (Annualised)
1.2
1.1
Aug 26
UK
GDP YoY
2.2
--
Top Losers
Price (`)
Chg (%)
Aug 30
US
Consumer Confidence
97.30
97.00
Hindcopper
66
(5.5)
Aug 31 Germany Unemployment change
(7.00)
--
Hindpetro
1,150
(5.3)
6.(
More Events on Pg4
Bhel
137
(4.6)
Pel
1,995
(3.5)
Bpcl
577
(3.3)
As on August 23, 2016
Market Outlook
August 24, 2016
News Analysis
ONGC Videsh Ltd. gets
1 year extension on exploring
Vietnamese oil block
ONGC Videsh Ltd, the overseas arm of Oil and Natural Gas Corp (ONGC), has
received one-year extension to explore Block - 128 a Vietnamese oil block in the
South China Sea. In May, OVL had applied to Vietnamese authorities for a fourth
extension of the exploration licence for the deepsea block to maintain India's
strategic interest in the South China Sea.
OVL had signed Production Sharing Contract (PSC) for the 7,058 square km Block
128 on May 24, 2006. The company has not found any hydrocarbon in the block
but is continuing to stay invested.
OVL first took a two-year extension of the exploration period till June 2014 and
then another extension one year later. A third extension was granted on May 28,
2015 and now a fourth extension has been granted. The company has so far
invested $50.88 million in the block.
Economic and Political News
Central Govt. examining proposal to ban cash transactions over `3 lakh
Union Finance minister calls for quick action to implement Insolvency and
Bankruptcy code
Jawaharlal Nehru Port Trust Signs Agreement for ECB worth $400 Million
Corporate News
British Petroleum unit to sell 8.53% stake in Castrol India
Honeywell launches electronic product lab in Hyderabad
Indian railways increases short distance coal freight rate by 8-14%
Quarterly Bloomberg Brokers Consensus Estimate
Tata Motors Ltd Consol - Aug 26, 2016
Particulars (` cr)
1QFY17E
1QFY16
y-o-y (%)
4QFY16 q-o-q (%)
Net sales
63,783
60,181
6.0
79,926
(20.2)
EBITDA
8,656
9,109
(5.0)
11,387
(24.0)
EBITDA margin (%)
13.6
15.1
14.2
Net profit
2,416
2,769
(12.8)
4,573
(47.2)
Market Outlook
August 24, 2016
Top Picks ★★★★★
Large Cap
Market Cap
CMP
Target
Upside
Company
Rationale
(` Cr)
(`)
(`)
(%)
To outpace battery industry growth due to better technological
Amara Raja Batteries
15,203
890
1,076
20.9
products leading to market share gains in both the automotive
OEM and replacement segments.
Uptick in defense capex by government, coupled with BELs
Bharat Electronics
29,294
1,221
1,414
15.8
strong market positioning, indicate good times ahead for BEL.
HCL Tech
1,11,330
789
1,000
26.7
Stock is trading at attractive valuations & factors all bad news.
Strong visibility for a robust 20% earnings trajectory, coupled
HDFC Bank
3,16,923
1,252
1,350
7.8
with high quality of earnings on account of high quality retail
business and strategic focus on highly rated corporates.
Back on the growth trend, expect a long term growth of 14% to
Infosys
2,38,710
1,039
1,370
31.8
be a US$20bn in FY2020.
Strong market positioning within the domestic AC markets to
Voltas
12,317
372
407
9.3
continue, EMP business set to revive
Source: Company, Angel Research
Mid Cap
Market Cap
CMP
Target
Upside
Company
Rationale
(` Cr)
(`)
(`)
(%)
Among the top 4 players in the consumer durables segment.
Bajaj Electricals
2,595
257
277
7.8
Improved profitability backed by turn around in E&P segment.
Strong order book lends earnings visibility.
Favourable outlook for the AC industry to augur well for
Cooling products business which is out pacing the market
Blue Star
4,629
485
527
8.6
growth. EMPPAC division's profitability to improve once
operating environment turns around.
Strong loan growth backed by diversified loan portfolio and
Equitas Holdings
6,077
181
235
29.7
adequate CAR. ROE & ROA likely to remain decent as risk of
dilution remains low. Attractive valuations considering growth.
Expectations of above average monsoon augurs well for
Goodyear India
1,241
538
631
17.2
Goodyear India as it derives ~50% of its turnover from farm
tyre segment.
Commencement of new projects, downtrend in the interest rate
IL&FS Transport
2,209
67
93
38.5
cycle, to lead to stock re-rating
Economic recovery to have favourable impact on advertising &
Jagran Prakashan
6,041
185
205
10.9
circulation revenue growth. Further, the acquisition of a radio business
(Radio City) would also boost the company`s revenue growth.
Speedier execution and speedier sales, strong revenue visibility
Mahindra Lifespace
1,796
438
522
19.2
in short-to-long run, attractive valuations
Massive capacity expansion along with rail advantage at ICD as
Navkar Corporation
2,856
200
265
32.3
well CFS augurs well for the company
Earnings boost on back of stable material prices and favourable
Radico Khaitan
1,278
96
125
30.1
pricing environment. Valuation discount to peers provides
additional comfort
Strong brands and distribution network would boost growth
Siyaram Silk Mills
1,116
1,191
1,347
13.1
going ahead. Stock currently trades at an inexpensive valuation.
Market leadership in Hindi news genre and no. 2 viewership
TV Today Network
1,765
296
363
22.7
ranking in English news genre, exit from the radio business, and
anticipated growth in ad spends by corporates to benefit the stock.
Source: Company, Angel Research
Market Outlook
August 24, 2016
Key Upcoming Events
Result Calendar
Date
Company
August 26, 2016
Tata Motors
Source: Bloomberg, Angel Research
Global economic events release calendar
Bloomberg Data
Date
Time
Country Event Description
Unit
Period
Last Reported Estimated
Aug 24, 2016
1:00 PM Germany
PMI Manufacturing
Value Aug P
53.80
7:30 PM
US
Existing home sales
Million
Jul
5.57
5.55
Aug 26, 2016
6:00 PM
US
GDP Qoq (Annualised)
% Change 2Q S
1.20
1.10
2:00 PM
UK
GDP (YoY)
% Change 2Q P
2.20
Aug 30, 2016
7:30 PM
US
Consumer Confidence S.A./ 1985=100 Aug
97.30
97.00
Aug 31, 2016
1:25 PM Germany
Unemployment change (000's)
Thousands Aug
(7.00)
Sep 01, 2016
2:00 PM
UK
PMI Manufacturing
Value Aug
48.20
6:30 AM
China
PMI Manufacturing
Value Aug
49.90
Source: Bloomberg, Angel Research
Market Outlook
August 24, 2016
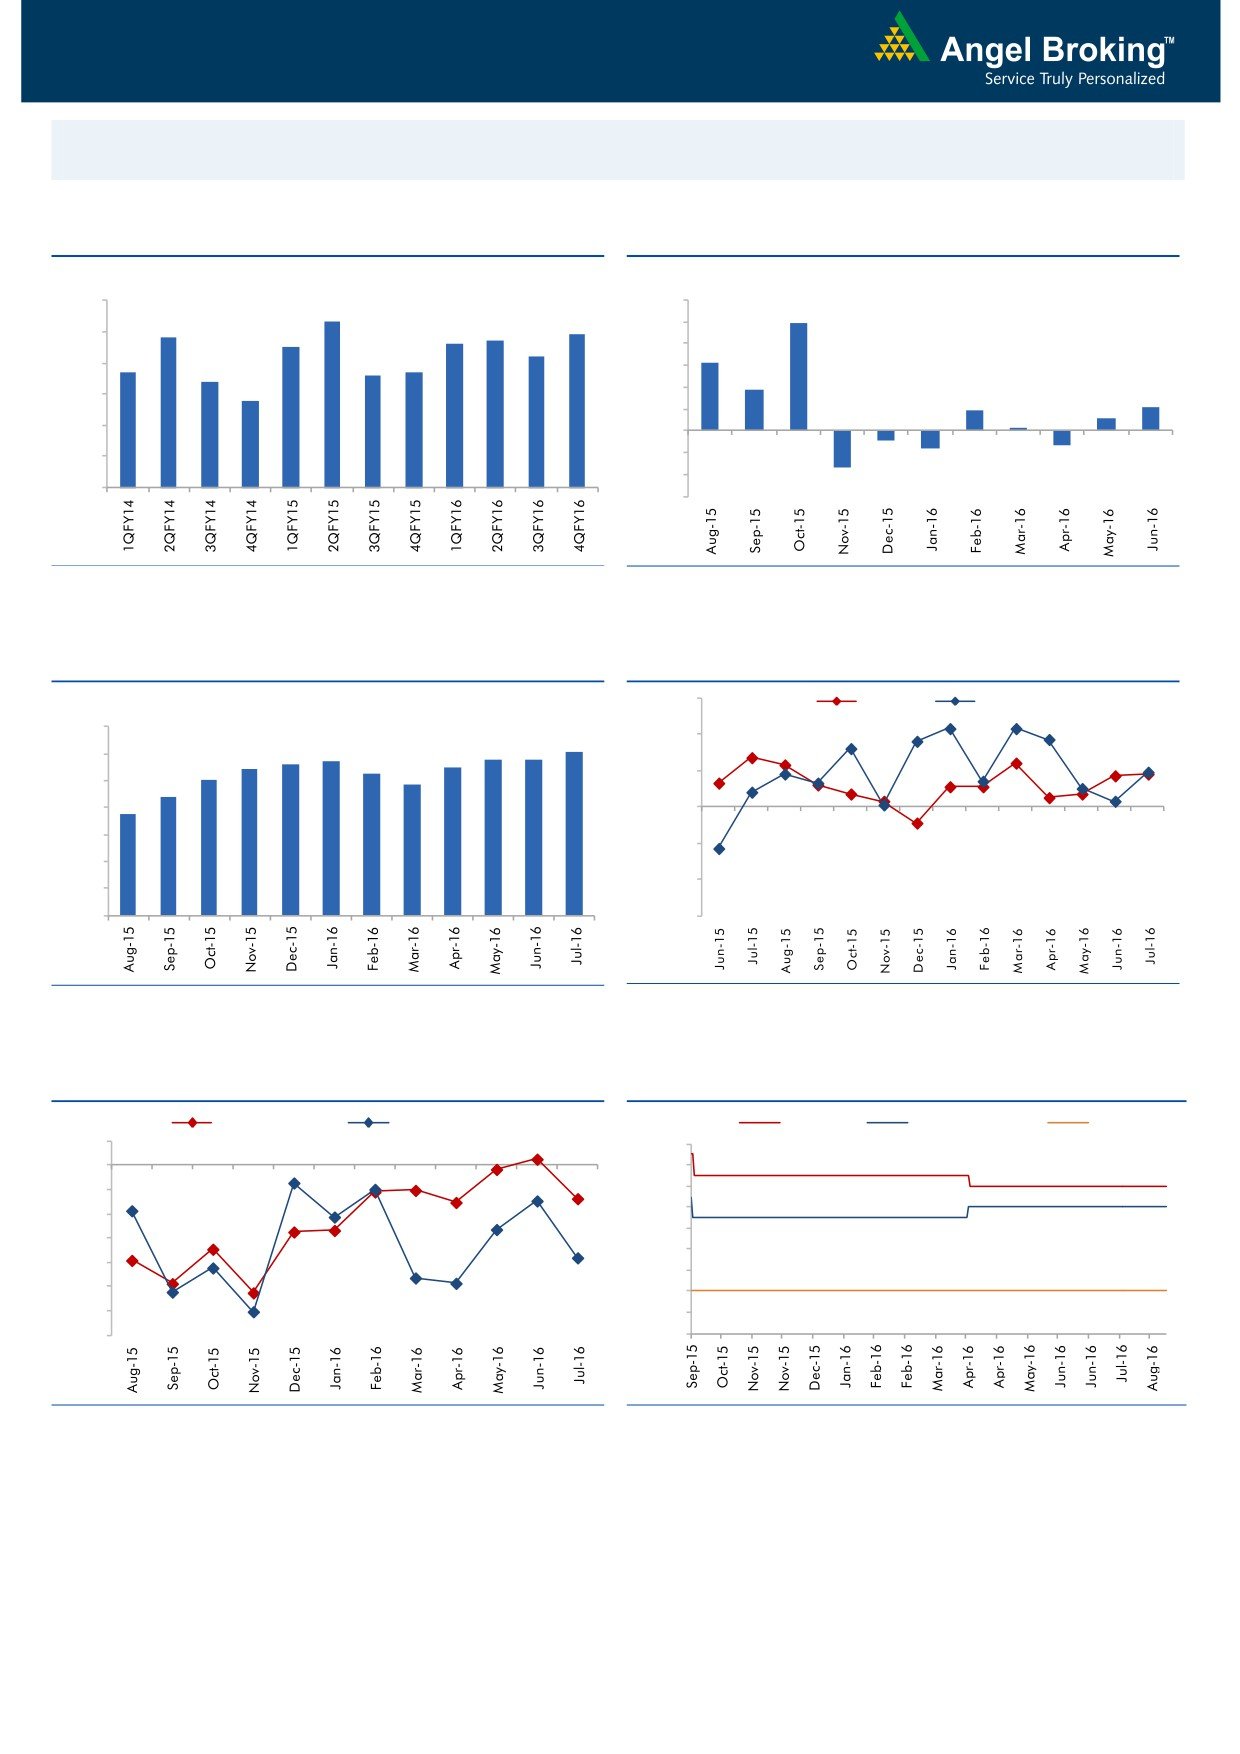
Macro watch
Exhibit 1: Quarterly GDP trends
Exhibit 2: IIP trends
(%)
(%)
9.0
8.3
12.0
9.9
7.8
7.7
7.9
10.0
8.0
7.5
7.6
7.2
8.0
6.3
6.7
6.6
6.7
7.0
6.4
6.0
3.7
5.8
4.0
2.1
6.0
1.9
1.1
2.0
0.3
5.0
-
4.0
(2.0)
(0.9)
(1.3)
(1.6)
(4.0)
3.0
(3.4)
(6.0)
Source: CSO, Angel Research
Source: MOSPI, Angel Research
Exhibit 3: Monthly CPI inflation trends
Exhibit 4: Manufacturing and services PMI
56.0
Mfg. PMI
Services PMI
(%)
7.0
6.1
54.0
5.6
5.7
5.8
5.8
5.4
5.5
6.0
5.3
5.0
4.8
52.0
5.0
4.4
3.7
4.0
50.0
3.0
48.0
2.0
46.0
1.0
-
44.0
Source: MOSPI, Angel Research
Source: Market, Angel Research; Note: Level above 50 indicates expansion
Exhibit 5: Exports and imports growth trends
Exhibit 6: Key policy rates
(%)
Exports yoy growth
Imports yoy growth
(%)
Repo rate
Reverse Repo rate
CRR
5.0
7.50
0.0
7.00
(5.0)
6.50
6.00
(10.0)
5.50
(15.0)
5.00
(20.0)
4.50
(25.0)
4.00
(30.0)
3.50
(35.0)
3.00
Source: Bloomberg, Angel Research
Source: RBI, Angel Research
Market Outlook
August 24, 2016
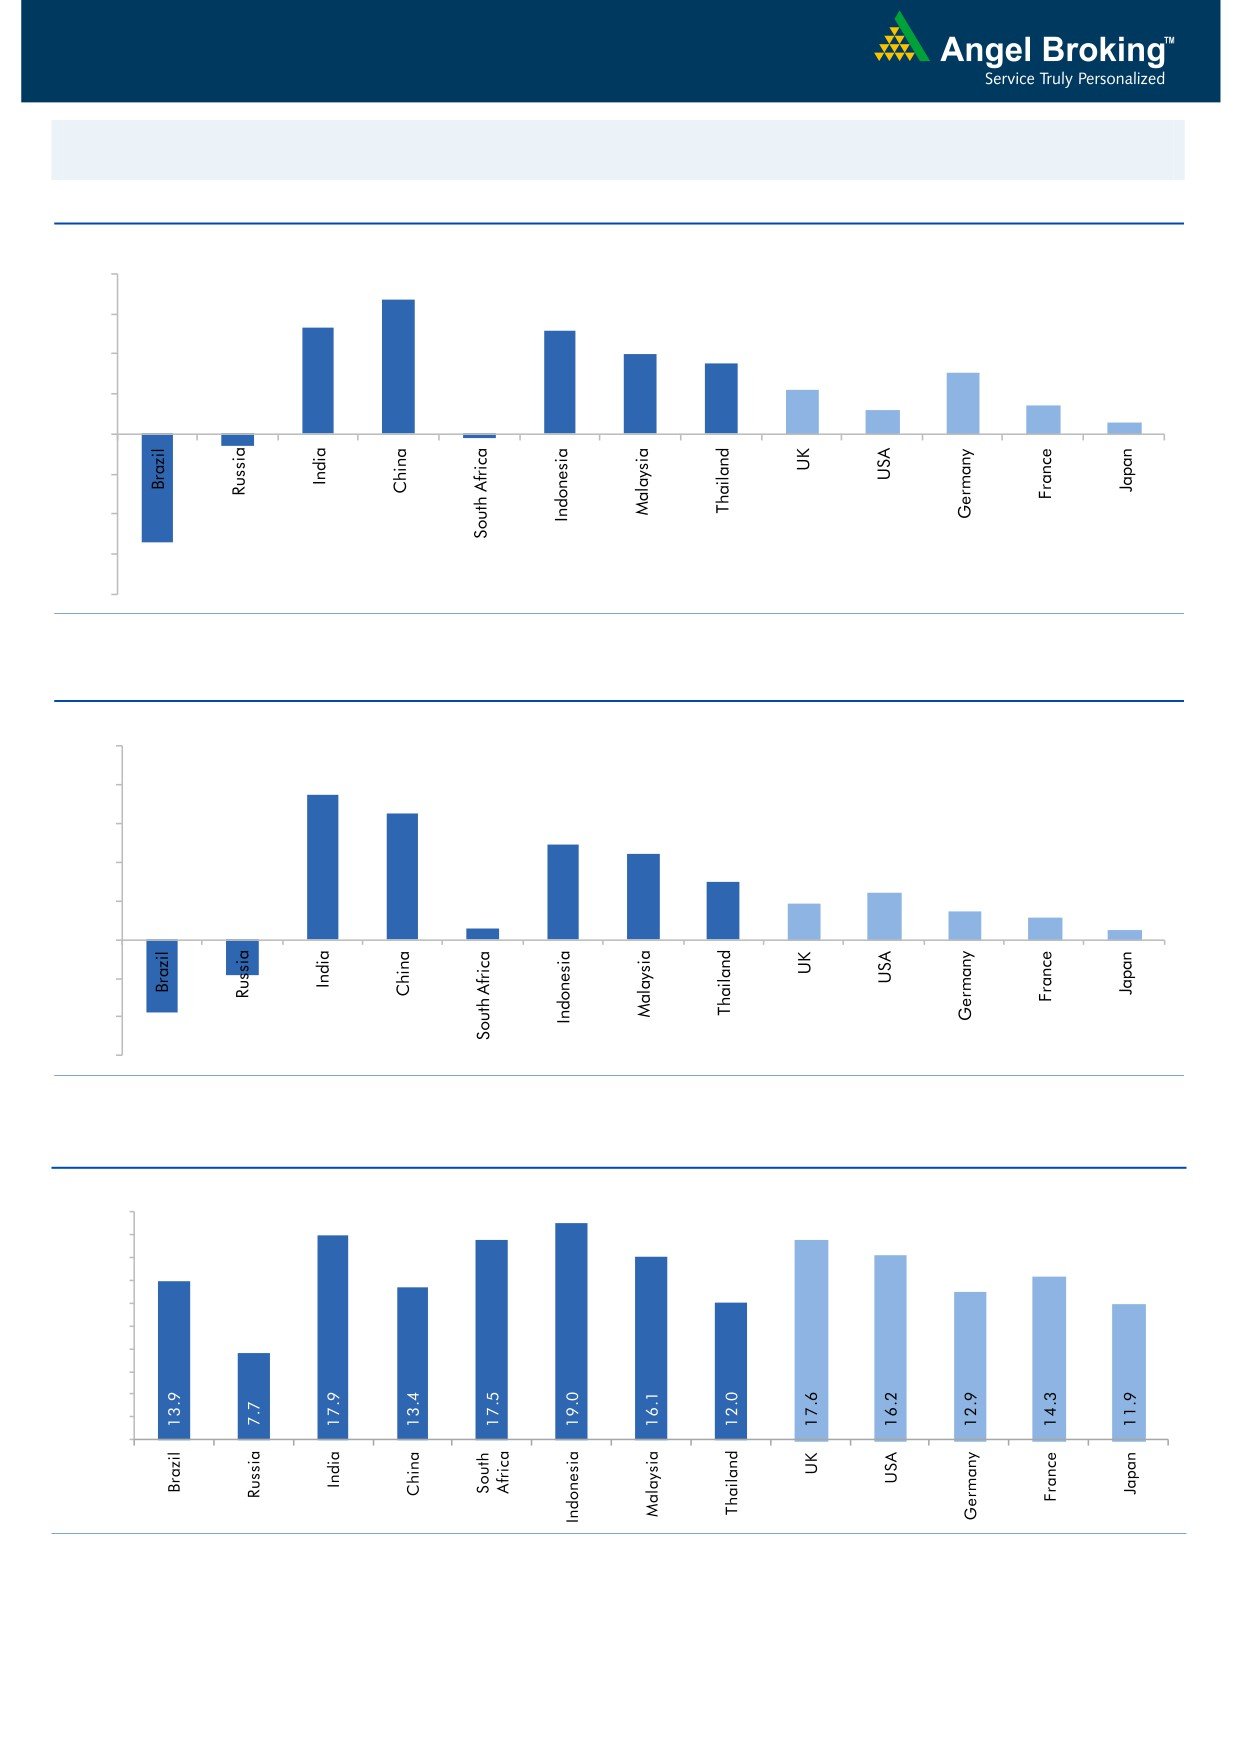
Global watch
Exhibit 1: Latest quarterly GDP Growth (%, yoy) across select developing and developed countries
(%)
8.0
6.7
6.0
5.3
5.2
4.0
3.5
4.0
3.1
2.2
2.0
1.2
1.4
0.6
-
(2.0)
(0.6)
(4.0)
(6.0)
(5.4)
(0.2)
(8.0)
Source: Bloomberg, Angel Research
Exhibit 2: 2016 GDP Growth projection by IMF (%, yoy) across select developing and developed countries
(%)
10.0
7.5
8.0
6.5
6.0
4.9
4.4
4.0
3.0
2.4
1.9
1.5
2.0
1.1
0.6
0.5
(3.8)
(1.8)
-
(2.0)
(4.0)
(6.0)
Source: IMF, Angel Research
Exhibit 3: One year forward P-E ratio across select developing and developed countries
(x)
20.0
18.0
16.0
14.0
12.0
10.0
8.0
6.0
4.0
2.0
-
Source: IMF, Angel Research
Market Outlook
August 24, 2016
Exhibit 4: Relative performance of indices across globe
Returns (%)
Country
Name of index
Closing price
1M
3M
1YR
Brazil
Bovespa
58,020
1.8
17.6
22.3
Russia
Micex
1,990
3.2
5.6
19.6
India
Nifty
8,633
1.4
11.7
1.3
China
Shanghai Composite
3,090
2.5
9.5
(22.1)
South Africa
Top 40
46,139
(0.1)
(0.8)
4.5
Mexico
Mexbol
47,666
0.3
4.3
13.5
Indonesia
LQ45
932
3.7
15.3
19.3
Malaysia
KLCI
1,683
1.5
3.3
5.4
Thailand
SET 50
981
2.9
9.6
6.8
USA
Dow Jones
18,547
(0.1)
6.0
18.4
UK
FTSE
6,869
2.1
10.4
14.9
Japan
Nikkei
16,497
(1.9)
(0.9)
(19.1)
Germany
DAX
10,593
4.4
3.8
2.7
France
CAC
4,421
0.9
(1.3)
(2.6)
Source: Bloomberg, Angel Research
Stock Watch
August 24, 2016
Company Name
Reco
CMP
Target
Mkt Cap
Sales ( Čcr )
OPM(%)
EPS (Č)
PER(x)
P/BV(x)
RoE(%)
EV/Sales(x)
(Č)
Price ( Č)
( Č cr )
FY17E FY18E
FY17E
FY18E
FY17E
FY18E
FY17E
FY18E
FY17E
FY18E
FY17E
FY18E
FY17E
FY18E
Agri / Agri Chemical
Rallis
Neutral
219
-
4,250
1,937
2,164
13.3
14.3
9.0
11.0
24.3
19.9
4.2
3.7
18.4
19.8
2.3
2.0
United Phosphorus
Accumulate
645
684
27,654
15,176
17,604
18.5
18.5
37.4
44.6
17.3
14.5
3.4
2.8
21.4
21.2
1.9
1.6
Auto & Auto Ancillary
Ashok Leyland
Buy
88
111
25,001
22,407
26,022
10.6
10.6
5.2
6.4
16.8
13.7
3.8
3.2
23.6
24.7
1.2
1.0
Bajaj Auto
Neutral
2,875
-
83,200
25,093
27,891
19.5
19.2
143.9
162.5
20.0
17.7
5.6
4.8
30.3
29.4
3.1
2.7
Bharat Forge
Neutral
861
-
20,040
7,726
8,713
20.5
21.2
35.3
42.7
24.4
20.2
4.5
4.1
18.9
20.1
2.6
2.3
Eicher Motors
Neutral
22,010
-
59,781
16,583
20,447
17.5
18.0
598.0
745.2
36.8
29.5
12.6
9.6
41.2
38.3
3.5
2.7
Gabriel India
Neutral
116
-
1,663
1,544
1,715
9.0
9.3
5.4
6.3
21.4
18.4
4.1
3.6
18.9
19.5
1.0
0.9
Hero Motocorp
Neutral
3,306
-
66,026
31,253
35,198
15.3
15.0
172.3
192.1
19.2
17.2
7.0
6.0
38.9
37.0
2.0
1.8
Jamna Auto Industries Neutral
217
-
1,735
1,486
1,620
9.8
9.9
15.0
17.2
14.5
12.6
3.2
2.7
21.8
21.3
1.3
1.2
L G Balakrishnan & Bros Neutral
461
-
723
1,302
1,432
11.6
11.9
43.7
53.0
10.5
8.7
1.5
1.4
13.8
14.2
0.6
0.6
Mahindra and Mahindra Neutral
1,442
-
89,565
46,534
53,077
11.6
11.7
67.3
78.1
21.4
18.5
3.5
3.0
15.4
15.8
1.9
1.7
Maruti
Neutral
4,833
-
146,003
69,186
82,217
14.7
14.4
198.5
241.4
24.4
20.0
4.7
3.8
20.2
20.0
1.8
1.5
Minda Industries
Neutral
1,281
-
2,032
2,728
3,042
9.0
9.1
68.2
86.2
18.8
14.9
4.3
3.4
23.8
24.3
0.7
0.6
Motherson Sumi
Neutral
326
-
43,168
45,896
53,687
7.8
8.3
13.0
16.1
25.0
20.3
8.1
6.4
34.7
35.4
1.0
0.9
Rane Brake Lining
Neutral
664
-
525
511
562
11.3
11.5
28.1
30.9
23.6
21.5
3.6
3.3
15.3
15.0
1.1
1.1
Setco Automotive
Neutral
46
-
609
741
837
13.0
13.0
15.2
17.0
3.0
2.7
0.5
0.5
15.8
16.3
1.2
1.1
Tata Motors
Neutral
504
-
145,385
300,209
338,549
8.9
8.4
42.7
54.3
11.8
9.3
1.9
1.6
15.6
17.2
0.6
0.5
TVS Motor
Accumulate
307
330
14,585
13,390
15,948
6.9
7.1
12.8
16.5
24.1
18.6
6.0
4.7
26.3
27.2
1.1
0.9
Amara Raja Batteries
Buy
890
1,076
15,203
5,717
6,733
18.7
18.9
38.4
48.9
23.2
18.2
5.8
4.7
25.3
24.8
2.6
2.1
Exide Industries
Neutral
175
-
14,867
7,439
8,307
15.0
15.0
8.1
9.3
21.6
18.8
3.0
2.7
14.3
16.7
1.6
1.5
Apollo Tyres
Neutral
173
-
8,783
12,877
14,504
14.3
13.9
21.4
23.0
8.1
7.5
1.3
1.1
16.4
15.2
0.9
0.8
Ceat
Buy
854
1,119
3,454
7,524
8,624
13.0
12.7
131.1
144.3
6.5
5.9
1.2
1.0
19.8
18.6
0.5
0.5
JK Tyres
Neutral
111
-
2,514
7,455
8,056
15.0
15.0
21.8
24.5
5.1
4.5
1.1
0.9
22.8
21.3
0.5
0.4
Swaraj Engines
Neutral
1,145
-
1,422
660
810
15.2
16.4
54.5
72.8
21.0
15.7
6.6
5.9
31.5
39.2
2.0
1.6
Subros
Neutral
103
-
617
1,488
1,681
11.7
11.9
6.4
7.2
16.1
14.4
1.7
1.5
10.8
11.4
0.7
0.6
Indag Rubber
Neutral
171
-
449
286
326
19.8
16.8
11.7
13.3
14.6
12.8
2.5
2.3
17.8
17.1
1.2
1.1
Capital Goods
ACE
Neutral
43
-
429
709
814
4.1
4.6
1.4
2.1
31.0
20.7
1.3
1.2
4.4
6.0
0.8
0.7
BEML
Accumulate
1,026
1,157
4,272
3,451
4,055
6.3
9.2
31.4
57.9
32.7
17.7
2.0
1.8
6.3
10.9
1.4
1.1
Bharat Electronics
Buy
1,221
1,414
29,294
8,137
9,169
16.8
17.2
58.7
62.5
20.8
19.5
3.2
2.9
44.6
46.3
2.6
2.3
Stock Watch
August 24, 2016
Company Name
Reco
CMP
Target
Mkt Cap
Sales ( Čcr )
OPM(%)
EPS (Č)
PER(x)
P/BV(x)
RoE(%)
EV/Sales(x)
(Č)
Price ( Č)
( Č cr )
FY17E
FY18E
FY17E
FY18E
FY17E
FY18E
FY17E
FY18E
FY17E
FY18E
FY17E
FY18E
FY17E
FY18E
Capital Goods
Voltas
Accumulate
372
407
12,317
6,511
7,514
7.9
8.7
12.9
16.3
28.9
22.8
5.2
4.6
16.7
18.5
1.6
1.4
BGR Energy
Neutral
114
-
820
16,567
33,848
6.0
5.6
7.8
5.9
14.6
19.3
0.8
0.8
4.7
4.2
0.2
0.1
BHEL
Neutral
137
-
33,520
28,797
34,742
-
2.8
2.3
6.9
59.5
19.9
1.0
1.0
1.3
4.8
0.8
0.6
Blue Star
Accumulate
485
527
4,629
4,351
5,024
6.4
7.1
17.2
20.6
28.3
23.5
18.4
15.3
23.1
24.1
1.1
1.0
Crompton Greaves
Neutral
87
-
5,428
5,777
6,120
5.9
7.0
3.3
4.5
26.2
19.2
1.2
1.1
4.4
5.9
0.9
0.8
Greaves Cotton
Neutral
133
-
3,250
1,755
1,881
16.8
16.9
7.8
8.5
17.1
15.7
3.4
3.2
20.6
20.9
1.6
1.5
Inox Wind
Buy
191
286
4,238
5,605
6,267
15.7
16.4
24.8
30.0
7.7
6.4
2.2
1.6
25.9
24.4
0.8
0.7
KEC International
Neutral
136
-
3,504
9,294
10,186
7.9
8.1
9.9
11.9
13.8
11.5
2.0
1.8
15.6
16.3
0.6
0.6
Thermax
Neutral
834
-
9,932
5,421
5,940
7.3
7.3
25.7
30.2
32.4
27.6
3.9
3.6
12.2
13.1
1.8
1.6
VATech Wabag
Buy
574
681
3,127
3,136
3,845
8.9
9.1
26.0
35.9
22.1
16.0
2.8
2.4
13.4
15.9
0.9
0.7
Cement
ACC
Neutral
1,655
-
31,087
11,225
13,172
13.2
16.9
44.5
75.5
37.2
21.9
3.5
3.3
11.2
14.2
2.8
2.4
Ambuja Cements
Neutral
271
-
53,741
9,350
10,979
18.2
22.5
5.8
9.5
46.7
28.5
3.9
3.5
10.2
12.5
4.5
3.9
India Cements
Neutral
140
-
4,305
4,364
4,997
18.5
19.2
7.9
11.3
17.7
12.4
1.3
1.2
8.0
8.5
1.6
1.4
JK Cement
Neutral
786
-
5,494
4,398
5,173
15.5
17.5
31.2
55.5
25.2
14.2
3.0
2.6
12.0
15.5
1.8
1.5
J K Lakshmi Cement
Neutral
442
-
5,197
2,913
3,412
14.5
19.5
7.5
22.5
58.9
19.6
3.6
3.1
12.5
18.0
2.4
2.0
Orient Cement
Neutral
173
-
3,535
2,114
2,558
18.5
20.5
8.1
11.3
21.3
15.3
3.1
2.7
9.0
14.0
2.2
1.8
UltraTech Cement
Neutral
3,826
-
105,003
25,768
30,385
21.0
23.5
111.0
160.0
34.5
23.9
4.4
3.9
13.5
15.8
4.2
3.5
Construction
ITNL
Buy
67
93
2,209
8,946
10,017
31.0
31.6
8.1
9.1
8.3
7.4
0.3
0.3
4.2
5.0
3.6
3.3
KNR Constructions
Neutral
687
-
1,932
1,210
1,595
15.4
16.0
33.9
52.1
20.3
13.2
3.1
2.7
13.6
18.0
1.7
1.2
Larsen & Toubro
Accumulate
1,476
1,700
137,527
67,665
77,249
10.7
11.5
57.3
71.2
25.8
20.7
2.4
2.2
12.6
14.3
2.2
1.9
Gujarat Pipavav Port
Neutral
171
-
8,245
705
788
52.2
51.7
5.0
5.6
34.1
30.5
3.4
3.0
11.2
11.2
11.6
9.9
MBL Infrastructures
Buy
117
285
485
2,797
3,405
14.7
15.4
21.0
34.8
5.6
3.4
0.6
0.5
11.0
16.2
0.8
0.8
Nagarjuna Const.
Neutral
86
-
4,784
8,842
9,775
9.1
8.8
5.3
6.4
16.2
13.5
1.3
1.2
8.2
9.1
0.7
0.6
PNC Infratech
Buy
118
647
3,035
2,350
2,904
13.4
13.7
48.0
42.0
2.5
2.8
0.5
0.4
16.8
13.2
1.4
1.1
Simplex Infra
Neutral
303
-
1,497
6,829
7,954
10.5
10.5
31.4
37.4
9.6
8.1
1.0
0.9
9.9
13.4
0.6
0.5
Power Mech Projects
Neutral
472
-
695
1,801
2,219
12.7
14.6
72.1
113.9
6.6
4.2
1.2
1.0
16.8
11.9
0.4
0.3
Sadbhav Engineering
Neutral
282
-
4,832
3,598
4,140
10.3
10.6
9.0
11.9
31.3
23.7
3.3
2.9
9.9
11.9
1.7
1.4
NBCC
Neutral
241
-
14,439
7,428
9,549
7.9
8.6
8.2
11.0
29.4
21.9
1.5
1.2
28.2
28.7
1.7
1.2
MEP Infra
Neutral
44
-
708
1,877
1,943
30.6
29.8
3.0
4.2
14.5
10.4
7.0
4.7
0.6
0.6
1.7
1.6
Stock Watch
August 24, 2016
Company Name
Reco
CMP
Target
Mkt Cap
Sales ( Čcr )
OPM(%)
EPS (Č)
PER(x)
P/BV(x)
RoE(%)
EV/Sales(x)
(Č)
Price ( Č)
( Č cr )
FY17E
FY18E
FY17E
FY18E
FY17E
FY18E
FY17E
FY18E
FY17E
FY18E
FY17E
FY18E
FY17E
FY18E
Construction
SIPL
Neutral
96
-
3,381
1,036
1,252
65.5
66.2
(8.4)
(5.6)
3.6
4.1
(22.8)
(15.9)
11.5
9.6
Engineers India
Neutral
232
-
7,812
1,725
1,935
16.0
19.1
11.4
13.9
20.3
16.7
2.8
2.7
13.4
15.3
3.4
3.0
Financials
Axis Bank
Neutral
582
-
138,981
58,081
66,459
3.5
3.5
32.4
44.6
18.0
13.0
2.4
2.1
13.6
16.5
-
-
Bank of Baroda
Neutral
164
-
37,846
19,980
23,178
1.8
1.8
11.5
17.3
14.3
9.5
1.6
1.4
8.3
10.1
-
-
Canara Bank
Neutral
265
-
14,414
15,225
16,836
1.8
1.8
14.5
28.0
18.3
9.5
1.3
1.0
5.8
8.5
-
-
Dewan Housing Finance Neutral
273
-
7,953
2,225
2,688
2.9
2.9
29.7
34.6
9.2
7.9
1.5
1.3
16.1
16.8
-
-
Equitas Holdings
Buy
181
235
6,077
939
1,281
11.7
11.5
5.8
8.2
31.2
22.1
2.7
2.4
10.9
11.5
-
-
Federal Bank
Neutral
67
-
11,538
9,353
10,623
2.9
2.9
4.4
5.8
15.3
11.6
1.5
1.3
9.5
11.0
-
-
HDFC
Neutral
1,376
-
217,549
11,475
13,450
3.4
3.4
45.3
52.5
30.4
26.2
5.9
5.2
20.2
20.5
-
-
HDFC Bank
Accumulate
1,252
1,350
316,923
46,097
55,433
4.5
4.5
58.4
68.0
21.4
18.4
3.8
3.1
18.8
18.6
-
-
ICICI Bank
Neutral
250
-
145,510
39,029
45,903
3.3
3.3
16.7
16.3
15.0
15.4
1.9
1.7
10.1
12.4
-
-
LIC Housing Finance
Neutral
552
-
27,850
3,712
4,293
2.6
2.5
39.0
46.0
14.2
12.0
2.7
2.3
19.9
20.1
-
-
Punjab Natl.Bank
Neutral
127
-
24,869
23,532
23,595
2.3
2.4
6.8
12.6
18.6
10.1
2.9
2.0
3.3
6.5
-
-
South Ind.Bank
Neutral
22
-
3,025
6,435
7,578
2.5
2.5
2.7
3.1
8.3
7.2
1.1
0.9
10.1
11.2
-
-
St Bk of India
Neutral
255
-
197,640
88,650
98,335
2.6
2.6
13.5
18.8
18.9
13.5
1.8
1.6
7.0
8.5
-
-
Union Bank
Neutral
135
-
9,311
13,450
14,925
2.3
2.3
25.5
34.5
5.3
3.9
0.8
0.7
7.5
10.2
-
-
Yes Bank
Neutral
1,342
-
56,502
8,978
11,281
3.3
3.4
74.0
90.0
18.1
14.9
3.4
2.9
17.0
17.2
-
-
FMCG
Asian Paints
Neutral
1,124
-
107,857
17,128
18,978
16.8
16.4
19.1
20.7
58.9
54.3
20.5
19.3
34.8
35.5
6.1
5.5
Britannia
Neutral
3,353
-
40,225
9,795
11,040
14.6
14.9
80.3
94.0
41.8
35.7
17.2
13.3
41.2
-
3.9
3.4
Colgate
Neutral
937
-
25,480
4,605
5,149
23.4
23.4
23.8
26.9
39.4
34.8
21.8
17.0
64.8
66.8
5.6
5.0
Dabur India
Neutral
291
-
51,226
8,315
9,405
19.8
20.7
8.1
9.2
36.0
31.7
10.0
8.3
31.6
31.0
6.0
5.3
GlaxoSmith Con*
Neutral
6,279
-
26,407
4,350
4,823
21.2
21.4
179.2
196.5
35.0
32.0
9.3
7.9
27.1
26.8
5.5
4.9
Godrej Consumer
Neutral
1,499
-
51,038
10,235
11,428
18.4
18.6
41.1
44.2
36.5
33.9
8.1
6.8
24.9
24.8
5.2
4.6
HUL
Neutral
922
-
199,533
35,252
38,495
17.6
17.4
20.4
21.9
45.1
42.1
37.1
32.5
82.2
77.3
5.4
4.9
ITC
Accumulate
251
283
303,339
40,059
44,439
39.0
39.2
9.1
10.1
27.6
24.9
7.5
6.6
27.2
26.5
7.1
6.4
Marico
Neutral
290
-
37,370
6,430
7,349
18.8
19.5
6.4
7.7
45.3
37.6
13.7
11.5
33.2
32.5
5.8
5.1
Nestle*
Neutral
6,808
-
65,642
10,073
11,807
20.7
21.5
124.8
154.2
54.6
44.2
22.4
20.1
34.8
36.7
6.2
5.3
Tata Global
Neutral
140
-
8,811
8,675
9,088
9.8
9.8
7.4
8.2
18.9
17.0
2.1
2.1
7.9
8.1
0.9
0.9
Procter & Gamble
Neutral
6,729
-
21,841
2,939
3,342
23.2
23.0
146.2
163.7
46.0
41.1
103.0
98.8
25.3
23.5
7.3
6.4
Hygiene
Stock Watch
August 24, 2016
Company Name
Reco
CMP
Target
Mkt Cap
Sales ( Čcr )
OPM(%)
EPS (Č)
PER(x)
P/BV(x)
RoE(%)
EV/Sales(x)
(Č)
Price ( Č)
( Č cr )
FY17E FY18E
FY17E
FY18E
FY17E
FY18E
FY17E
FY18E
FY17E
FY18E
FY17E
FY18E
FY17E
FY18E
IT
HCL Tech^
Buy
789
1,000
111,330
49,242
57,168
20.5
20.5
55.7
64.1
14.2
12.3
2.9
2.2
20.3
17.9
2.1
1.7
Infosys
Buy
1,039
1,370
238,710
69,934
79,025
27.5
27.5
64.8
72.0
16.0
14.4
3.5
3.2
22.0
22.3
2.8
2.4
TCS
Accumulate
2,603
3,004
512,942
121,684
136,286
27.3
27.3
135.0
150.1
19.3
17.3
6.4
5.9
33.2
33.9
4.0
3.6
Tech Mahindra
Buy
466
700
45,210
30,347
33,685
17.0
17.0
37.5
41.3
12.4
11.3
2.7
2.3
21.8
20.7
1.2
1.1
Wipro
Buy
520
680
128,366
51,631
55,822
21.7
17.9
35.9
36.9
14.5
14.1
3.0
2.8
19.0
18.1
2.2
2.0
Media
D B Corp
Neutral
408
-
7,497
2,297
2,590
27.4
28.2
21.0
23.4
19.4
17.4
4.5
3.9
23.7
23.1
3.0
2.6
HT Media
Neutral
78
-
1,822
2,693
2,991
12.6
12.9
7.9
9.0
9.9
8.7
0.8
0.8
7.8
8.3
0.3
0.1
Jagran Prakashan
Accumulate
185
205
6,041
2,355
2,635
28.0
28.0
9.9
10.8
18.7
17.1
3.7
3.2
21.7
21.7
2.6
2.3
Sun TV Network
Neutral
465
-
18,321
2,850
3,265
70.1
71.0
26.2
30.4
17.7
15.3
4.5
4.0
24.3
25.6
6.3
5.4
Hindustan Media
Neutral
271
-
1,985
1,016
1,138
24.3
25.2
27.3
30.1
9.9
9.0
1.9
1.7
16.2
15.8
1.3
1.1
Ventures
TV Today Network
Buy
296
363
1,765
637
743
27.5
27.5
18.4
21.4
16.1
13.8
2.8
2.4
17.4
17.2
2.4
2.0
Metals & Mining
Coal India
Neutral
337
-
212,609
84,638
94,297
21.4
22.3
24.5
27.1
13.7
12.4
5.7
5.5
42.6
46.0
2.0
1.8
Hind. Zinc
Neutral
227
-
96,063
14,252
18,465
55.9
48.3
15.8
21.5
14.4
10.6
2.3
2.1
17.0
20.7
6.8
5.2
Hindalco
Neutral
155
-
32,080
107,899
112,095
7.4
8.2
9.2
13.0
16.9
12.0
0.8
0.8
4.8
6.6
0.8
0.8
JSW Steel
Neutral
1,760
-
42,550
53,201
58,779
16.1
16.2
130.6
153.7
13.5
11.5
1.8
1.6
14.0
14.4
1.6
1.4
NMDC
Neutral
109
-
43,196
6,643
7,284
44.4
47.7
7.1
7.7
15.4
14.2
1.3
1.3
8.8
9.2
4.1
3.7
SAIL
Neutral
50
-
20,609
47,528
53,738
(0.7)
2.1
(1.9)
2.6
19.2
0.5
0.5
(1.6)
3.9
1.3
1.2
Vedanta
Neutral
174
-
51,601
71,744
81,944
19.2
21.7
13.4
20.1
13.0
8.7
1.1
1.0
8.4
11.3
1.1
0.8
Tata Steel
Neutral
385
-
37,436
121,374
121,856
7.2
8.4
18.6
34.3
20.7
11.2
1.3
1.2
6.1
10.1
0.9
0.9
Oil & Gas
Cairn India
Neutral
204
-
38,294
9,127
10,632
4.3
20.6
8.8
11.7
23.2
17.5
0.8
0.7
3.3
4.2
5.6
4.6
GAIL
Neutral
367
-
46,559
56,220
65,198
9.3
10.1
27.1
33.3
13.5
11.0
1.2
1.2
9.3
10.7
1.0
0.9
ONGC
Neutral
238
-
203,877
137,222
152,563
15.0
21.8
19.5
24.1
12.2
9.9
1.0
1.0
8.5
10.1
1.8
1.6
Petronet LNG
Neutral
334
-
25,084
-
0
-
-
-
-
-
-
Indian Oil Corp
Neutral
544
-
132,069
373,359
428,656
5.9
5.5
54.0
59.3
10.1
9.2
1.6
1.4
16.0
15.6
0.5
0.4
Reliance Industries
Neutral
1,010
-
327,455
301,963
358,039
12.1
12.6
87.7
101.7
11.5
9.9
1.2
1.1
10.7
11.3
1.6
1.3
Pharmaceuticals
Alembic Pharma
Neutral
643
-
12,119
3,483
4,083
20.2
21.4
24.3
30.4
26.5
21.2
6.0
4.8
25.5
25.3
3.4
2.8
Aurobindo Pharma
Buy
736
877
43,086
15,720
18,078
23.7
23.7
41.4
47.3
17.8
15.6
4.6
3.6
29.6
26.1
3.0
2.6
Aventis*
Neutral
4,315
-
9,937
2,357
2,692
17.3
17.3
153.5
169.2
28.1
25.5
4.8
3.9
25.8
28.4
3.9
3.2
Cadila Healthcare
Accumulate
372
400
38,053
11,126
13,148
22.0
22.0
17.1
20.0
21.7
18.6
5.6
4.4
28.8
26.6
3.4
2.8
Stock Watch
August 24, 2016
Company Name
Reco
CMP
Target
Mkt Cap
Sales ( Čcr )
OPM(%)
EPS (Č)
PER(x)
P/BV(x)
RoE(%)
EV/Sales(x)
(Č)
Price ( Č)
( Č cr )
FY17E FY18E
FY17E
FY18E
FY17E
FY18E
FY17E
FY18E
FY17E
FY18E
FY17E
FY18E
FY17E
FY18E
Pharmaceuticals
Cipla
Reduce
555
490
44,594
15,378
18,089
17.4
18.4
21.6
27.2
25.7
20.4
3.3
2.9
13.7
15.2
3.1
2.6
Dr Reddy's
Neutral
3,008
-
51,298
16,043
18,119
23.1
24.7
126.0
157.8
23.9
19.1
3.5
3.0
15.7
17.1
3.2
2.8
Dishman Pharma
Sell
177
45
2,851
1,718
1,890
22.7
22.8
9.5
11.3
18.6
15.6
1.8
1.6
10.1
10.9
2.1
1.8
GSK Pharma*
Neutral
3,076
-
26,054
3,528
3,811
16.6
18.8
51.8
59.4
59.4
51.8
15.9
15.8
26.3
30.6
7.3
6.8
Indoco Remedies
Sell
304
225
2,802
1,112
1,289
18.2
18.2
13.2
15.6
23.0
19.5
4.1
3.5
19.2
19.2
2.6
2.3
Ipca labs
Buy
511
613
6,449
3,303
3,799
15.3
15.3
17.3
19.7
29.5
25.9
2.6
2.4
9.1
9.4
2.1
1.8
Lupin
Accumulate
1,555
1,809
70,090
15,912
18,644
26.4
26.7
58.1
69.3
26.8
22.4
5.2
4.3
21.4
20.9
4.6
3.8
Sun Pharma
Buy
763
944
183,510
31,129
35,258
30.0
30.9
28.0
32.8
27.2
23.3
4.2
3.5
18.7
18.9
5.7
4.8
Power
Tata Power
Neutral
75
-
20,231
36,916
39,557
17.4
27.1
5.1
6.3
14.7
11.9
1.3
1.2
9.0
10.3
1.6
1.4
NTPC
Neutral
159
-
130,938
86,605
95,545
17.5
20.8
11.8
13.4
13.5
11.9
1.4
1.3
10.5
11.1
2.9
2.9
Power Grid
Neutral
182
-
95,215
25,763
29,762
74.3
73.1
14.8
17.3
12.3
10.5
1.9
1.7
16.9
17.5
8.0
7.6
Real Estate
MLIFE
Buy
438
554
1,796
925
1,139
18.4
22.3
18.3
33.8
23.9
13.0
1.1
1.1
4.9
8.5
2.6
2.1
Telecom
Bharti Airtel
Neutral
354
-
141,328
105,086
114,808
34.5
34.7
12.2
16.4
29.0
21.6
2.0
1.8
6.8
8.4
2.3
2.0
Idea Cellular
Neutral
101
-
36,296
40,133
43,731
37.2
37.1
6.4
6.5
15.8
15.5
1.3
1.2
8.2
7.6
1.9
1.6
zOthers
Abbott India
Neutral
4,665
-
9,912
3,153
3,583
14.1
14.4
152.2
182.7
30.7
25.5
150.5
128.5
25.6
26.1
2.9
2.5
Bajaj Electricals
Accumulate
257
277
2,595
5,099
5,805
5.7
5.9
11.4
14.6
22.6
17.6
3.0
2.7
13.4
15.1
0.5
0.4
Finolex Cables
Neutral
430
-
6,571
2,883
3,115
12.0
12.1
14.2
18.6
30.3
23.1
16.1
14.1
15.8
14.6
2.0
1.8
Goodyear India*
Buy
538
631
1,241
1,598
1,704
10.4
10.2
49.4
52.6
10.9
10.2
50.3
44.1
18.2
17.0
0.5
62.3
Hitachi
Neutral
1,550
-
4,215
2,081
2,433
8.8
8.9
33.4
39.9
46.4
38.9
37.5
31.2
22.1
21.4
1.8
1.5
Jyothy Laboratories
Neutral
292
-
5,281
1,440
2,052
11.5
13.0
8.5
10.0
34.3
29.2
8.3
7.7
18.6
19.3
3.9
2.7
MRF
Buy
35,795
45,575
15,181
-
0
-
-
-
-
-
-
Page Industries
Neutral
14,282
-
15,930
2,450
3,124
20.1
17.6
299.0
310.0
47.8
46.1
318.1
242.8
47.1
87.5
6.5
5.1
Relaxo Footwears
Neutral
464
-
5,566
2,085
2,469
9.2
8.2
7.6
8.0
61.3
58.3
23.8
20.3
17.9
18.8
2.8
2.4
Siyaram Silk Mills
Buy
1,191
1,347
1,116
1,799
2,040
11.6
11.7
104.9
122.4
11.4
9.7
1.9
1.6
16.4
16.4
0.8
0.7
Styrolution ABS India*
Neutral
564
-
992
1,440
1,537
9.2
9.0
40.6
42.6
13.9
13.2
35.5
32.2
12.3
11.6
0.6
0.6
TVS Srichakra
Buy
2,518
2,932
1,928
2,304
2,614
13.7
13.8
231.1
266.6
10.9
9.4
282.9
222.8
33.9
29.3
0.8
0.7
HSIL
Neutral
365
-
2,636
2,384
2,515
15.8
16.3
15.3
19.4
23.8
18.8
23.7
20.4
7.8
9.3
1.2
1.1
Kirloskar Engines India
Neutral
279
-
4,035
2,554
2,800
9.9
10.0
10.5
12.1
26.6
23.1
11.1
10.5
10.7
11.7
1.3
1.1
Ltd
M M Forgings
Neutral
426
-
515
546
608
20.4
20.7
41.3
48.7
10.3
8.8
58.4
51.7
16.6
17.0
0.8
0.7
Stock Watch
August 24, 2016
Company Name
Reco
CMP
Target
Mkt Cap
Sales ( Čcr )
OPM(%)
EPS (Č)
PER(x)
P/BV(x)
RoE(%)
EV/Sales(x)
(Č)
Price ( Č)
( Č cr )
FY17E
FY18E
FY17E
FY18E
FY17E
FY18E
FY17E
FY18E
FY17E
FY18E
FY17E
FY18E
FY17E
FY18E
zOthers
Banco Products (India) Neutral
220
-
1,570
1,353
1,471
12.3
12.4
14.5
16.3
15.1
13.5
20.9
18.8
14.5
14.6
1.1
117.4
Competent Automobiles Neutral
184
-
113
1,137
1,256
3.1
2.7
28.0
23.6
6.6
7.8
35.4
32.0
14.3
11.5
0.1
0.1
Nilkamal
Neutral
1,240
-
1,850
1,995
2,165
10.7
10.4
69.8
80.6
17.8
15.4
70.9
61.6
16.6
16.5
0.9
0.8
Visaka Industries
Neutral
160
-
255
1,051
1,138
10.3
10.4
21.0
23.1
7.6
6.9
20.6
19.3
9.0
9.2
0.5
0.5
Transport Corporation of
Neutral
347
-
2,657
2,671
2,911
8.5
8.8
13.9
15.7
25.0
22.2
3.4
3.1
13.7
13.8
1.1
1.0
India
Elecon Engineering
Accumulate
56
63
613
1,482
1,660
13.7
14.5
3.9
5.8
14.4
9.7
3.4
3.1
7.8
10.9
0.7
0.7
Surya Roshni
Buy
175
201
767
3,342
3,625
7.8
7.5
17.3
19.8
10.1
8.9
19.2
15.4
10.5
10.8
0.5
0.4
MT Educare
Neutral
144
-
574
366
417
17.7
18.2
9.4
10.8
15.4
13.3
3.4
3.0
22.2
22.3
1.3
1.1
Radico Khaitan
Buy
96
125
1,278
1,659
1,802
13.0
13.2
6.3
7.4
15.2
13.0
1.3
1.2
8.6
9.3
1.3
1.1
Garware Wall Ropes
Neutral
511
-
1,118
873
938
12.9
13.1
30.9
34.9
16.5
14.6
2.6
2.2
15.7
15.2
1.2
1.1
Wonderla Holidays
Neutral
409
-
2,313
287
355
38.0
40.0
11.3
14.2
36.2
28.8
5.2
4.5
21.4
23.9
7.6
6.1
Linc Pen & Plastics
Accumulate
289
283
427
382
420
9.3
9.5
13.5
15.7
21.4
18.4
3.7
3.2
17.1
17.3
1.1
1.0
The Byke Hospitality
Neutral
161
-
644
287
384
20.5
20.5
7.6
10.7
21.1
15.0
4.4
3.6
20.7
23.5
2.3
1.7
Interglobe Aviation
Neutral
895
-
32,254
21,122
26,005
14.5
27.6
110.7
132.1
8.1
6.8
48.4
34.6
168.5
201.1
1.5
1.2
Coffee Day Enterprises
Neutral
247
-
5,083
2,964
3,260
20.5
21.2
4.7
8.0
-
30.8
2.9
2.6
5.5
8.5
2.1
1.9
Ltd
Navneet Education
Neutral
103
-
2,460
1,062
1,147
24.0
24.0
6.1
6.6
17.0
15.6
3.5
3.1
20.6
19.8
2.3
2.2
Navkar Corporation
Buy
200
265
2,856
408
612
42.9
42.3
6.8
11.5
29.6
17.4
2.1
1.8
6.9
10.5
7.7
5.2
UFO Moviez
Neutral
480
-
1,326
619
685
33.2
33.4
30.0
34.9
16.0
13.8
2.2
1.9
13.8
13.9
2.0
1.6
VRL Logistics
Neutral
296
-
2,704
1,902
2,119
16.7
16.6
14.6
16.8
20.4
17.6
4.5
3.9
21.9
22.2
1.6
1.4
Team Lease Serv.
Neutral
1,100
-
1,881
3,229
4,001
1.5
1.8
22.8
32.8
48.3
33.5
5.2
4.5
10.7
13.4
0.5
0.4
S H Kelkar & Co.
Neutral
293
-
4,241
1,036
1,160
15.1
15.0
6.1
7.2
48.0
40.9
5.1
4.7
10.7
11.5
3.9
3.5
Quick Heal
Neutral
240
-
1,682
408
495
27.3
27.0
7.7
8.8
31.0
27.3
2.9
2.9
9.3
10.6
3.3
2.7
Narayana Hrudaya
Neutral
319
-
6,523
1,873
2,166
11.5
11.7
2.6
4.0
120.7
80.5
7.4
6.7
6.1
8.3
3.4
2.9
Manpasand Bever.
Neutral
727
-
3,637
836
1,087
19.6
19.4
16.9
23.8
43.0
30.5
5.2
4.5
12.0
14.8
4.1
3.0
Parag Milk Foods
Neutral
317
-
2,664
1,919
2,231
9.3
9.6
9.5
12.9
33.5
24.5
5.2
4.3
15.5
17.5
1.5
1.3
Source: Company, Angel Research; Note: *December year end; #September year end; &October year end; Price as on August 23, 2016
Market Outlook
August 24, 2016
Research Team Tel: 022 - 39357800
DISCLAIMER
Angel Broking Private Limited (hereinafter referred to as “Angel”) is a registered Member of National Stock Exchange of India
Limited,Bombay Stock Exchange Limited and Metropolitan Stock Exchange Limited. It is also registered as a Depository Participant with
CDSL and Portfolio Manager with SEBI. It also has registration with AMFI as a Mutual Fund Distributor. Angel Broking Private Limited is a
registered entity with SEBI for Research Analyst in terms of SEBI (Research Analyst) Regulations, 2014 vide registration number
INH000000164. Angel or its associates has not been debarred/ suspended by SEBI or any other regulatory authority for accessing
/dealing in securities Market. Angel or its associates/analyst has not received any compensation / managed or
co-managed public offering of securities of the company covered by Analyst during the past twelve months.
This document is solely for the personal information of the recipient, and must not be singularly used as the basis of any investment
decision. Nothing in this document should be construed as investment or financial advice. Each recipient of this document should make
such investigations as they deem necessary to arrive at an independent evaluation of an investment in the securities of the companies
referred to in this document (including the merits and risks involved), and should consult their own advisors to determine the merits and
risks of such an investment.
Reports based on technical and derivative analysis center on studying charts of a stock's price movement, outstanding positions and
trading volume, as opposed to focusing on a company's fundamentals and, as such, may not match with a report on a company's
fundamentals. Investors are advised to refer the Fundamental and Technical Research Reports available on our website to evaluate the
contrary view, if any.
The information in this document has been printed on the basis of publicly available information, internal data and other reliable
sources believed to be true, but we do not represent that it is accurate or complete and it should not be relied on as such, as this
document is for general guidance only. Angel Broking Pvt. Limited or any of its affiliates/ group companies shall not be in any way
responsible for any loss or damage that may arise to any person from any inadvertent error in the information contained in this report.
Angel Broking Pvt. Limited has not independently verified all the information contained within this document. Accordingly, we cannot
testify, nor make any representation or warranty, express or implied, to the accuracy, contents or data contained within this document.
While Angel Broking Pvt. Limited endeavors to update on a reasonable basis the information discussed in this material, there may be
regulatory, compliance, or other reasons that prevent us from doing so.
This document is being supplied to you solely for your information, and its contents, information or data may not be reproduced,
redistributed or passed on, directly or indirectly.
Neither Angel Broking Pvt. Limited, nor its directors, employees or affiliates shall be liable for any loss or damage that may arise from
or in connection with the use of this information.